
Sample report
What you show a sponsor when they ask what they got.
This is the real engagement view from a demo conference — the same screen you'd be looking at a fortnight after your own event wraps.
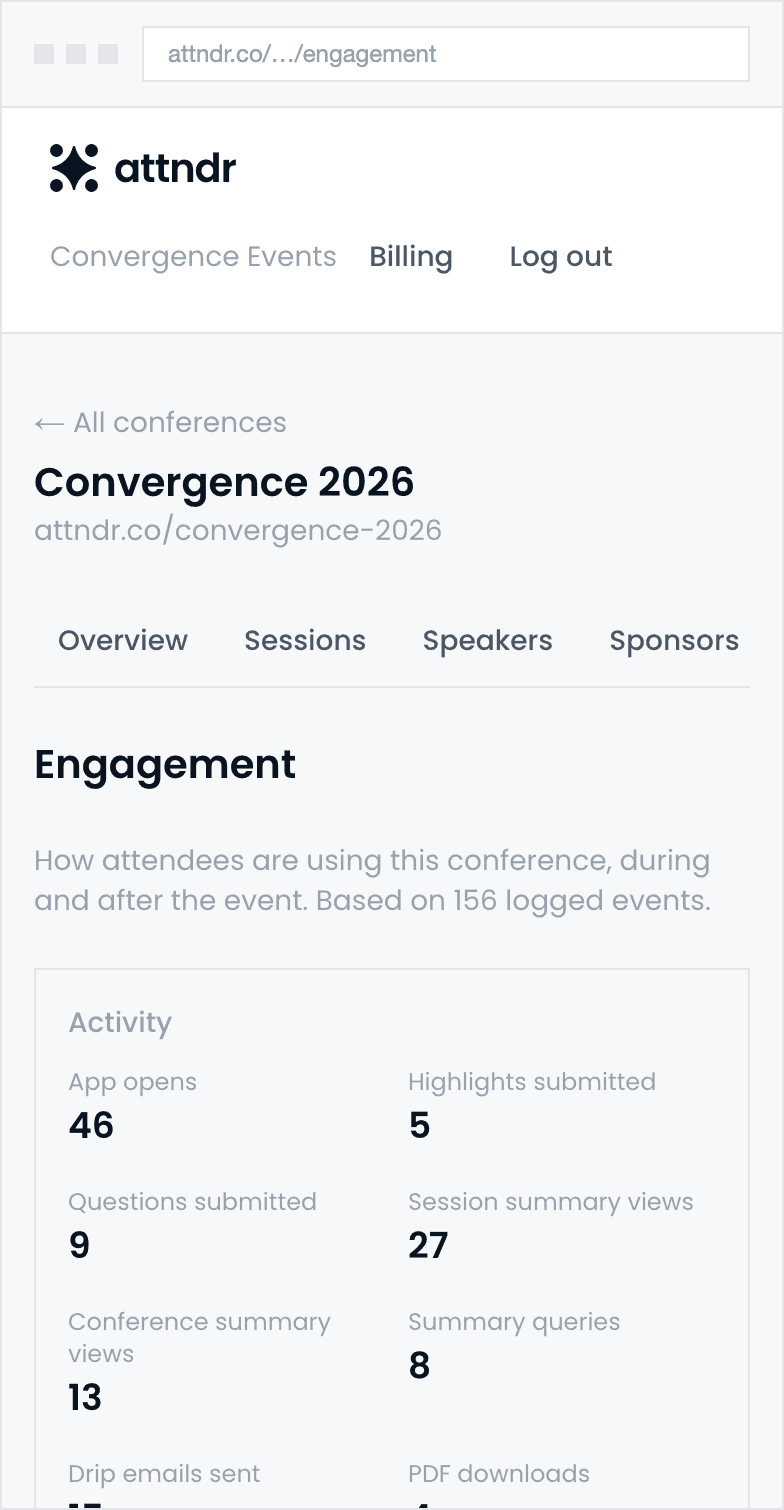
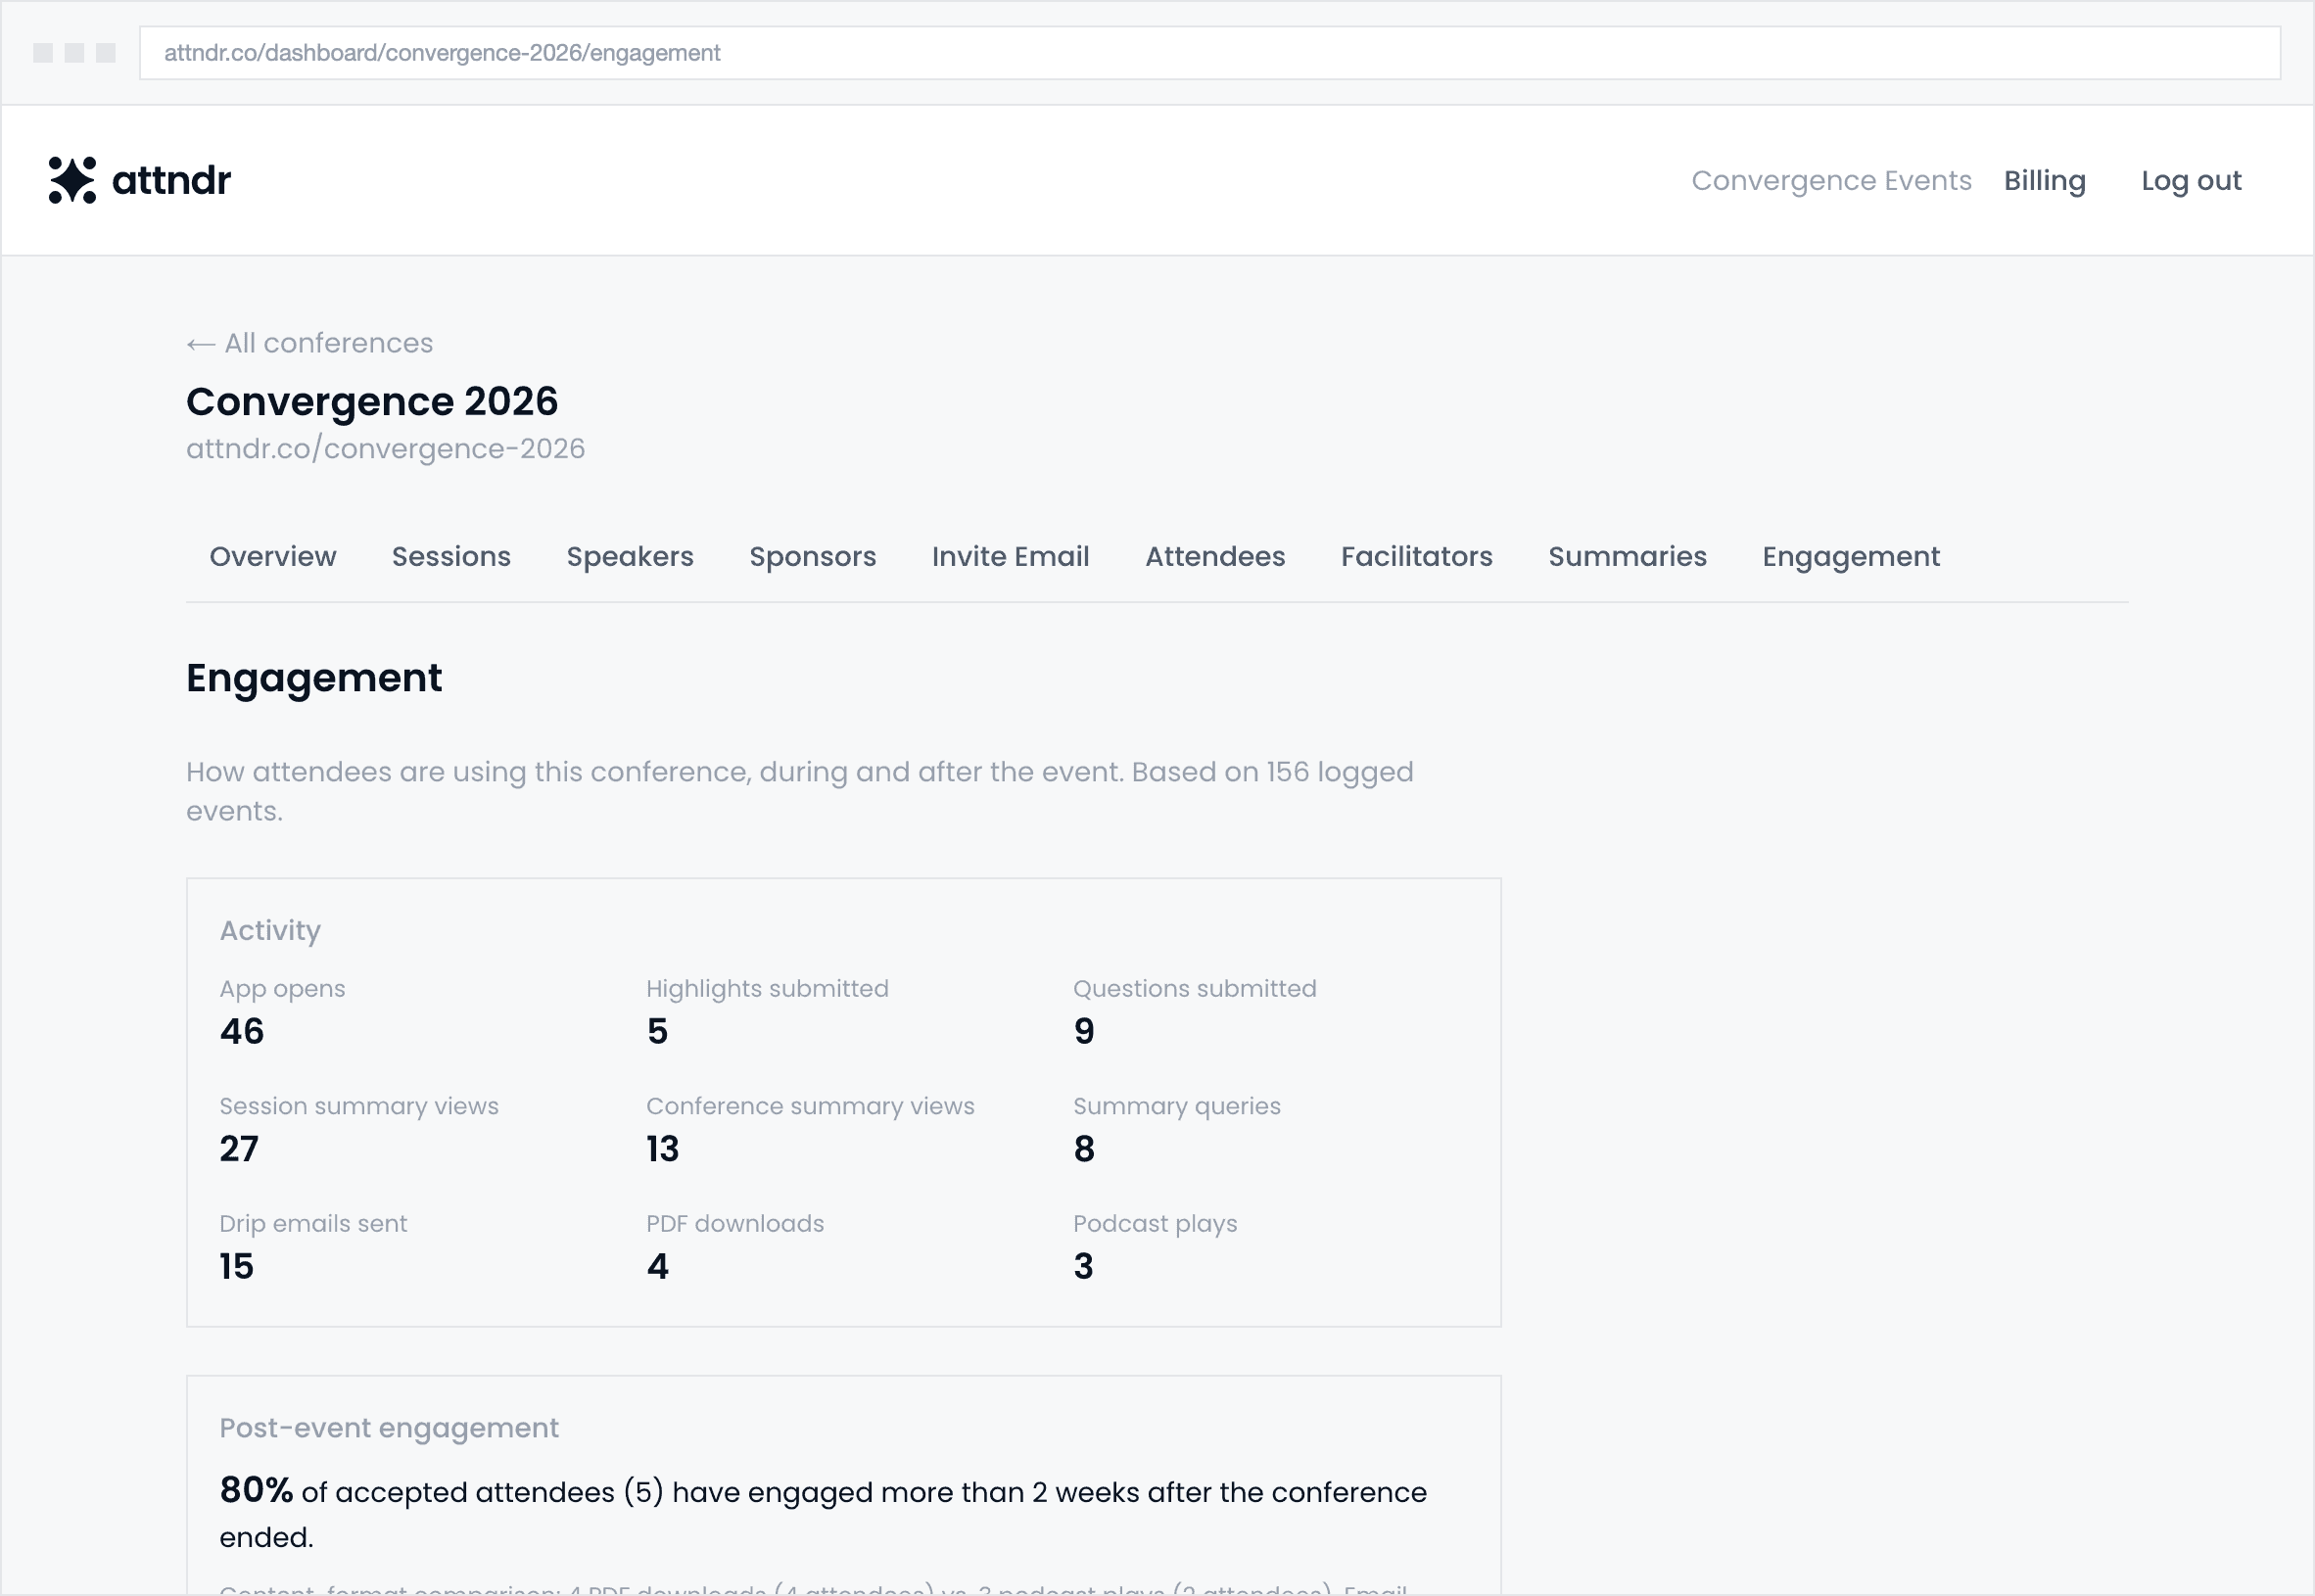
Figures shown are from a demo conference used for testing, not a customer's event.
How to read it in a sponsor conversation
Reach
App opens and summary views show how much attention the content held onto — not how many badges were scanned at the door. It's the difference between a headcount and evidence anyone actually engaged with what you built.
Depth
Highlights, questions asked, and follow-up content delivered separate the people who attended from the people who engaged. A single glance and a genuine return visit look identical as a raw open count — this is the number that tells them apart.
Longevity
The one figure scoped to after the event ends: how many attendees were still opening your content two weeks later. Day-of enthusiasm is easy and expected — this is the number that shows whether any of it lasted past the closing keynote.
Want to see it against your own event's shape?
Book a demo